Risk graphs
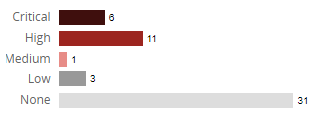
At the top of the page are security, license, and operational risk graphs:
-
The number displayed before the risk severity bars in the risk graphs indicates the number of components (listed in the table and in subprojects) in this BOM that have that type of risk.
-
The color of the bars in the risk graphs and in the table corresponds to the severity of risk that they represent:

-
Critical risk: dark red - 50% black and 50% red (security risk only)
-
High risk: 100% red
-
Medium risk: light red - 50% red
-
Low risk: 100% gray
-
None: light gray - 50% gray
-
To filter the table by risk category and severity:
-
Select a severity label/graph to filter the table to show only those components and subprojects that have a specific type and severity of risk.
-
Use the advanced filters feature to select risk categories and severity levels.
