Viewing your dashboards
Use dashboards to view the types and severity of risk and policy violations that are associated with the components that are in one or more versions of your projects. Dashboards provide an overall view across your projects, components, and vulnerabilities.
So that you can view the projects and project versions that are important to you, Black Duck's provides two default dashboards and the ability for you to create an unlimited number of custom dashboards.
Black Duck displays these two default dashboards:
-
Watching. Your watched projects.
-
My Projects. All of your projects, including projects that you are not watching.
These dashboards display information on the Dashboard page at the project level.
In addition, you can create custom dashboards so that you can quickly view the project versions, component versions, and vulnerabilities that are important to you: search for projects, components, and/or vulnerabilities and then save the searches; use the Dashboard page to view the information from those saved searches.
Viewing dashboards
To view the dashboards, click ![]() .
.
The dashboard page that appears depends on the last dashboard (a specific Dashboard page or Summary Dashboard) you viewed previously. If not displayed, select Dashboard to display your dashboards.
About the Watching and My Projects dashboards
Use the Watching or My Projects dashboards to view risk and policy violation information at the project level.
The following information is shown for each project:

- To view policy violation information for a specific project:
Use the bar to view the number of project versions with the highest policy severity level.
 Note: The text states the number of project versions with this highest policy severity level, not all policy severity levels affecting this project.
Hover over the bar to see the number of project versions with their highest severity level of policy violations:
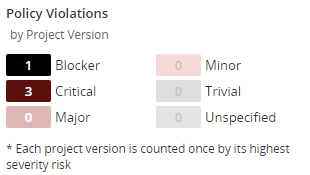
In the above example, there are four project versions which have policy violations; one version has a policy violation which has Blocker as the highest severity level, the other three versions have Critical as the highest severity level. Note that this does not indicate the number of policy violations in these versions, just the highest severity level for each version.
- To view risk information:
Use the risk bar to view the number of project versions with the highest risk level:
Security risk:

License risk:

Operational risk:
 Note: The text states the number of project versions with this highest risk level, not all risk levels affecting the versions.
Hover over a risk bar to see the number of versions of this project with their highest level of risk.
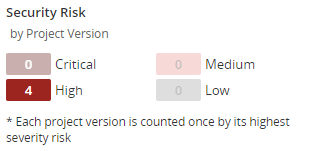
If a project version has risk, the version is only counted once and only its highest risk level is shown.
- Use the graphs to see overview information for all projects in this dashboard.
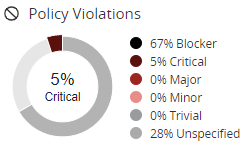
The risk graph shows the percentage of projects in this dashboard that have policy violations by severity level. You can also hover over an area in the graph to view this information:
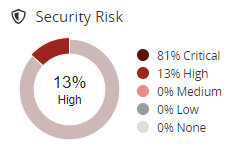
The risk graphs show the percentage of projects in this dashboard that have this level of security, license, or operational risk. You can also hover over an area in the graph to view this information:
Hover over a value in the legend to highlight the value in the graph.
- View additional information for each project, including:
Number of versions.
Last scan date.
Date when this project was last updated, such as when a scan that was mapped to any project version was last run or when the BOM for any project version was last updated, either manually or by a new scan.
-
Select a project name to view the Project Name page which lists all versions of this project.
- Manage how the projects are shown in these dashboards:
Use the Sort by field to select an attribute to sort by and click an arrow to select the sort order
 (ascending) or
  (descending).
Use the Filter projects field to filter the projects shown in either dashboard.
-
Use the icons
 to manage
your watched projects or delete a project.
About saved searches dashboards
Use a saved search to view the project versions, component versions, and vulnerabilities that are important to you.
For each saved search, Black Duck lists the date and time this search was last updated.
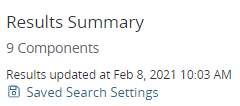
Select Saved Search Settings to view the filters for this saved search.

Select Edit Saved Search to open the Find page displaying your saved search. Use the page to edit and save this revised saved search.
Project version saved searches
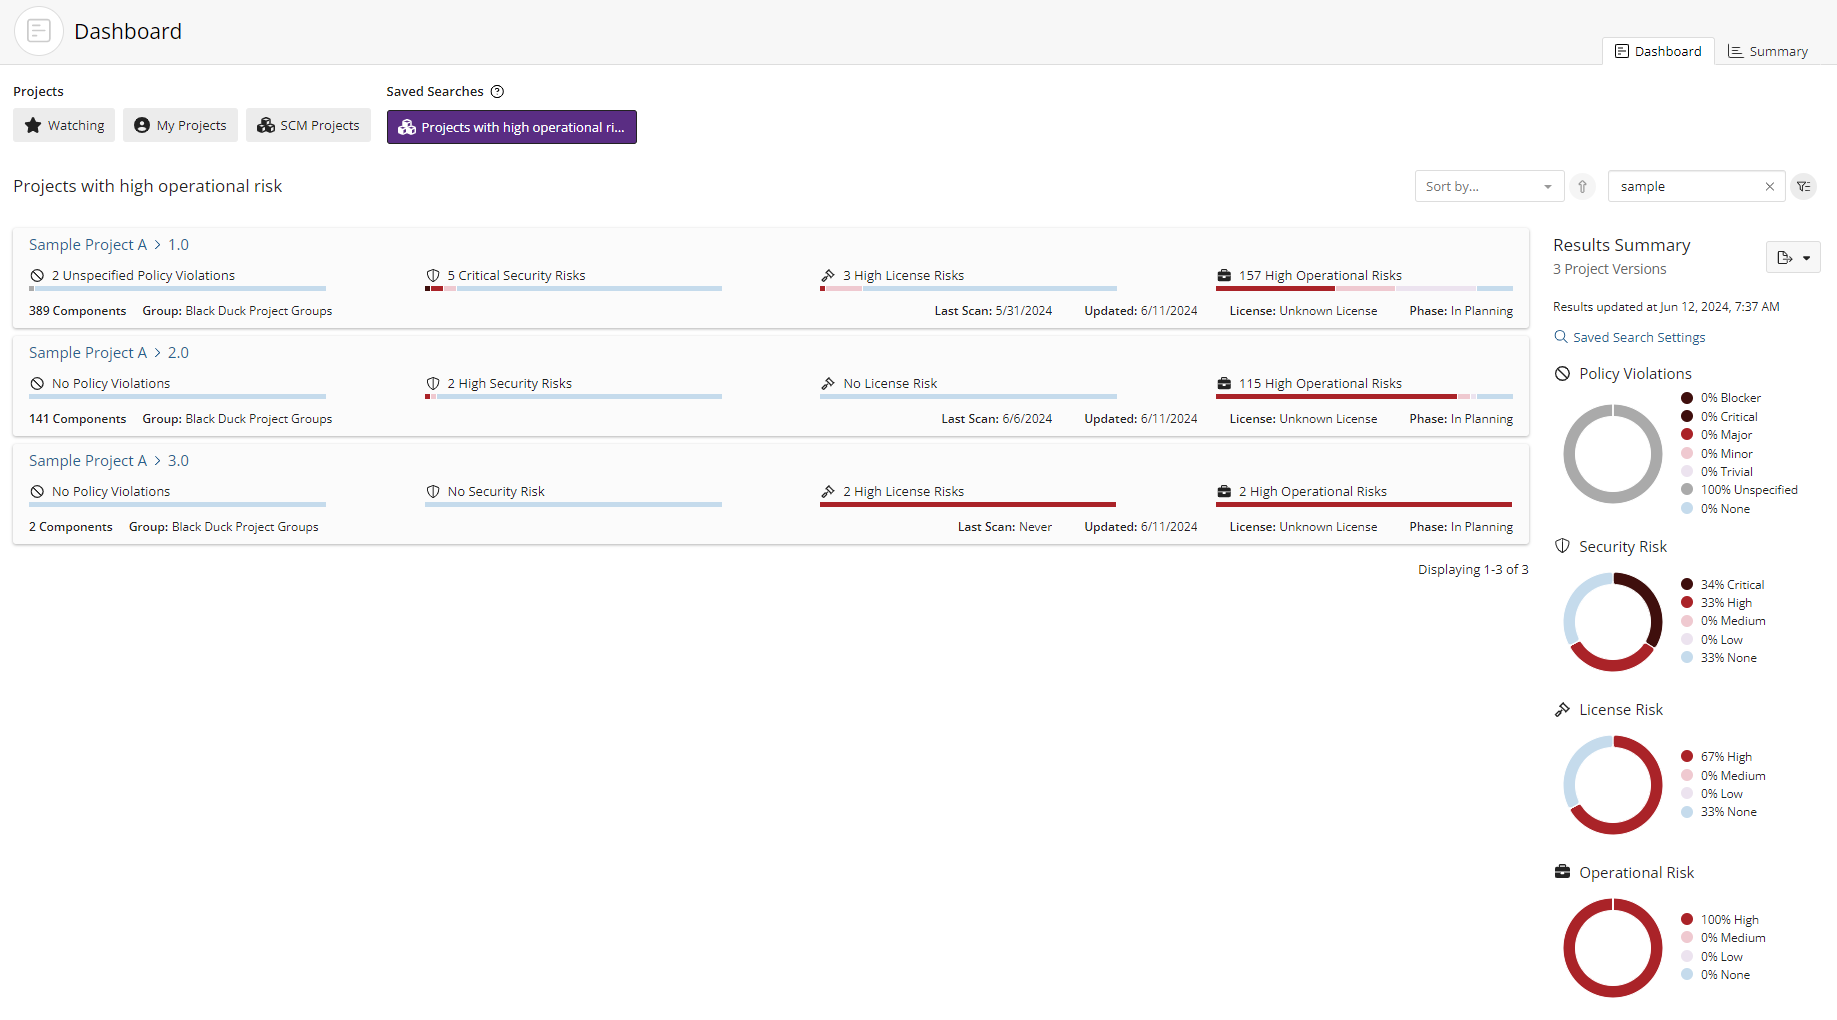
The following information is shown for each project version:

-
 located in front of the saved search name indicates that this
is a project saved search.
 - To view policy violation information for a specific project version:
Use the bar to see the number of components with the highest policy severity level for this project version.
For example, the following shows that while there are components with lower severity levels, the highest policy severity level for this project version is Blocker and there are five components that have Blocker as their highest policy severity level.
 Note: The text states the number of components with the highest policy severity level for this project version, not all policy severity levels affecting this project version.
Hover over the bar to see the number of components with policy violations by the highest policy severity level:
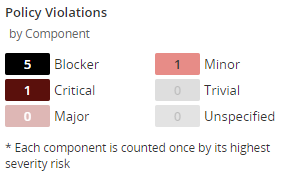
If a component has a policy violation, the component is only counted once and only its highest policy severity level is shown.
-
To view risk information:
-
Use the risk bars to quickly view the number of components with the highest level of security, license, or operational risk.
Security risk:

License risk:

Operational risk:

For example, the following shows that while there are components with lower risk, the highest security risk for this project version is High and that one component in this project version has a high level of security risk as their highest risk level:

-
Hover over the bar to see the number of components for each risk category.
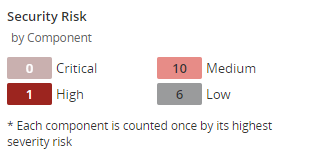
In this example, there is one component that has a high risk level as its highest risk, 10 components that have medium risk as their highest risk level, and six components that have low risk as their highest risk level.
Note: Each component is only counted once and is shown with its highest risk level.
-
-
Use the graphs to view overview information for all project versions in this dashboard categorized by policy severity and risk levels. The graphs lists the percentages for each level. You can also:
-
Hover over the graph to view the percentage of project versions with policy violations for each policy severity level.

-
Hover over the graph to view the percentage of project versions in this dashboard for each risk level.

-
Hover over a value in the legend to highlight the value in the graph.
-
- For each project version, the dashboard also shows:
Number of components in this project version.
Last scan date.
Date when this project version was last updated, such as when a scan that was mapped to this project version was last run or when the BOM for this project version was last updated, either manually or by a new scan.
License of this project version.
Phase for this project version.
Distribution of this project version.
-
Select the project or version name to view the BOM.
- Manage how the projects are shown in these dashboards:
Use the Sort by field to select an attribute to sort by and click an arrow to select the sort order
 (ascending) or
  (descending).
Use the Filter projects field to filter the projects shown in the dashboard.
Component saved searches
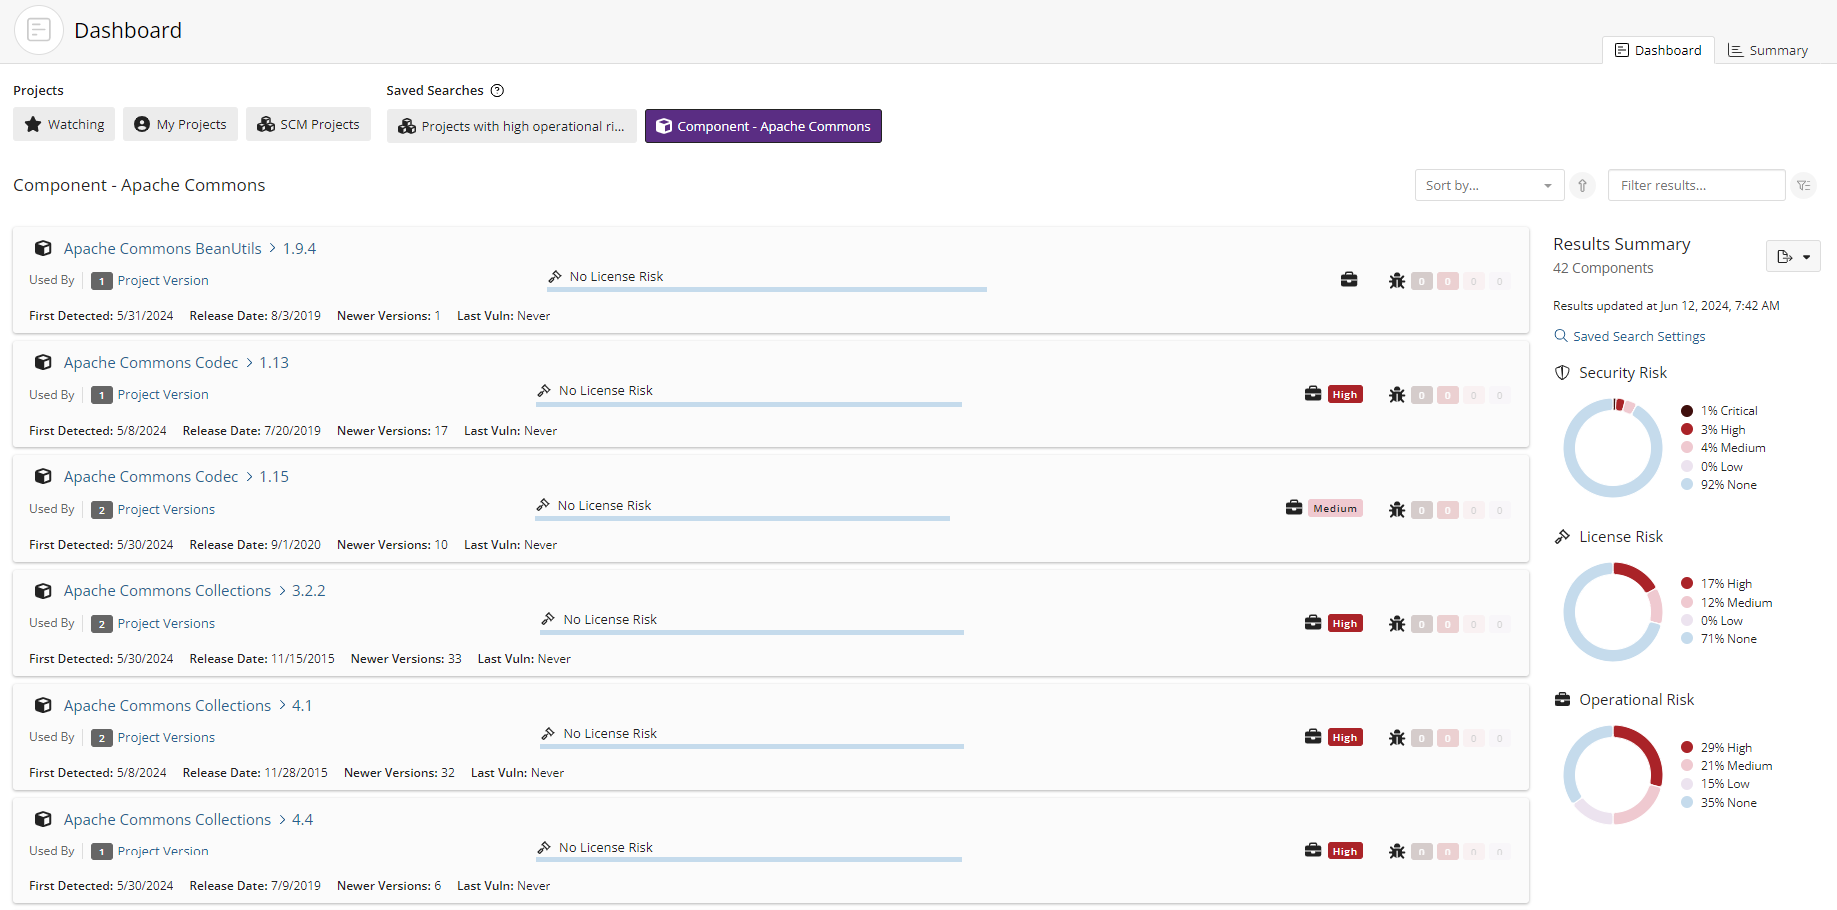
The following information is shown for each component.

-
 located in front of the saved search name indicates that this
is a component saved search.
 -
Select the component name/version to display the Component Name Version page.
-
View the number of project versions that use this component version as shown by the value next to Used By.

Select Project Versions to open the Where Used dialog box.

This dialog box shows the project versions that use this version of the component.
Column Description Project Name Name of project and version that uses this component version. Select the project name to display the project version's Components tab. Phase License License for this component version. Review Status Whether this component has been reviewed in this project version.
Security Risk
Lists the vulnerabilities for each severity level, from left to right: Critical, High, Medium, and Low.

Select a value to display the Security tab of the Black Duck KBComponent Name Version page, which lists the vulnerabilities associated with this version of this component.
-
Use the bar to quickly see the number of components with the highest policy severity level.

Select the bar to see the number of components with policy violations by severity level:
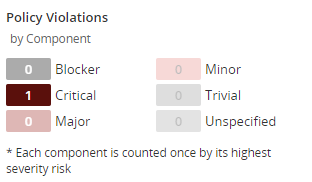
Note: A component is only counted once with the highest policy severity level, not all policy severity levels affecting this component. -
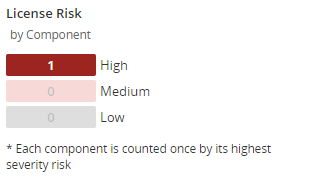
Use the bar to quickly view the number of components with the highest level of license risk.

Select the bar to view the number of components in each risk category.
-
View the operational risk for this component version:

-
View the number of vulnerabilities by severity associated with this component version for each severity level, from left to right: Critical, High, Medium, and Low.
The Last Vuln date is the date when a vulnerability for this component was last updated in Black Duck (by the Black Duck KnowledgeBase or a user).

Select a value to display the Security tab of the Black Duck KBComponent Name Version page, which lists the vulnerabilities associated with this version of this component.
- For each component version, the search results also show:
Approval status. Status indicates whether this component version has been reviewed.
First detected date.
Date this component version was released.
Number of newer versions.
Date when a vulnerability for the component was last updated in Black Duck (by updates from Black Duck KnowledgeBase or a user manually changing the associated vulnerability and so on).
-
Manage how the components are shown in these dashboards:
-
Use the Sort by field to select an attribute to sort by and click an arrow to select the sort order
 (ascending) or
  (descending).
 -
Use the filter field to filter the components shown in the dashboard.
-
Vulnerability saved searches
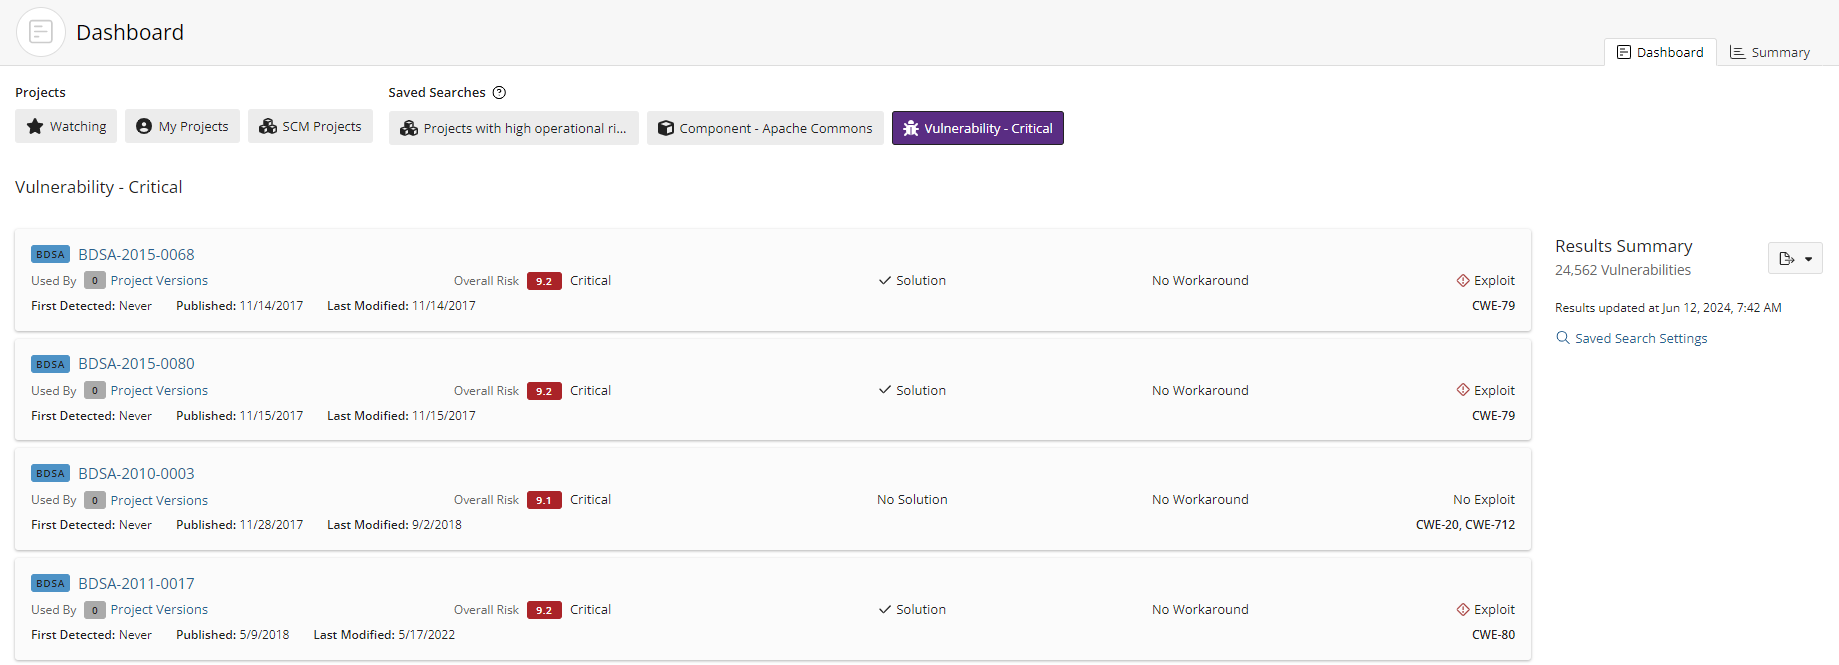
The following information is shown for each vulnerability:

-
Select the vulnerability ID to view more information about the vulnerability, such as additional score values. You can view National Vulnerability Database (NVD) information by selecting the CVE number or view Black Duck Security Advisory (BDSA) information by selecting the BDSA number.
-
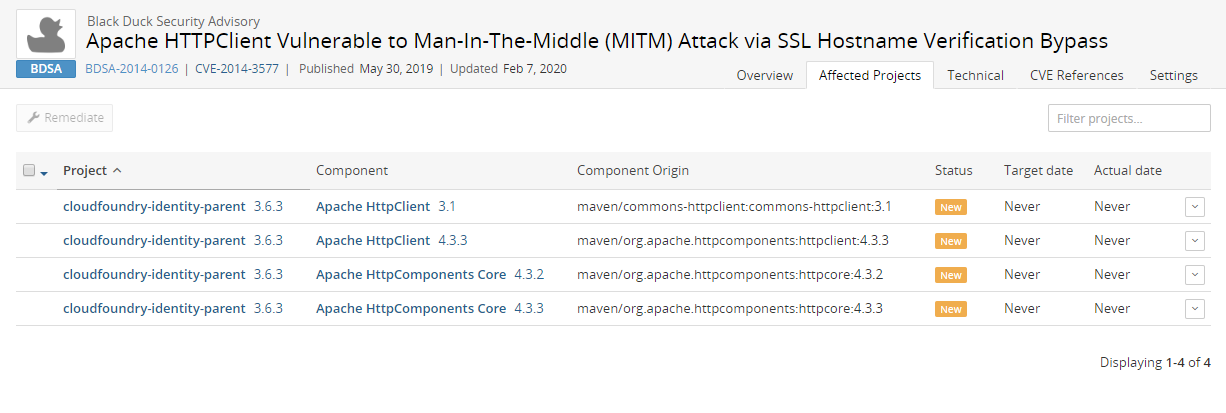
View the number of project versions that affected by this vulnerability next to Used By.

Select Project Versions to open the Affected Projects tab for the vulnerability which lists the project versions affected by this vulnerability.
-
View the overall risk score. The search results show the Temporal Score for BDSA vulnerabilities, or the Base Score for NVD vulnerabilities and the associated risk level. Note that the score shown and risk level depends on the selected security rankings.
Select the score to view individual scores: temporal, base, exploitability, and impact for BDSA; base, exploitability, and impact for NVD.
- View whether a solution, workaround, or exploit is available:
 indicates that there is a solution or workaround available for
this vulnerability.
 indicates there is an exploit for this
vulnerability.
- For each vulnerability, the search results also show:
First Detected.
Published date.
Last modified date.
Common Weakness Enumeration (CWE) number for this security vulnerability.
Exporting to CSV
You can export your Dashboard to CSV which converts the individual rows to tabular data. To do
so, click the 

